ELK Stack - A Hands-On Tutorial

ELK Stack has been in the DevSecOps toolkit for the past few years and it is the widely used log aggregation stack.
The practical applications include shipping, processing, and monitoring of:
- Application logs, API and Webserver logs
- Uptime
- Network data
- Audit data
- Operating System Behavior
- any data source whose pattern can be interpreted.
ELK Stack, parses and transforms the logs to extract, store, and visualize the information. This post will help you understand the components of the ELK stack and will get you up and running to process logs on your local machine.
ELK Stack and Components
ELK is an acronym for ‘Elasticsearch’, ‘Logstash’ and ‘Kibana’. The log aggregation framework is made up of all these three components along with ‘beats’ agents to ship the logs to the stack. The components can be visually understood as follows:
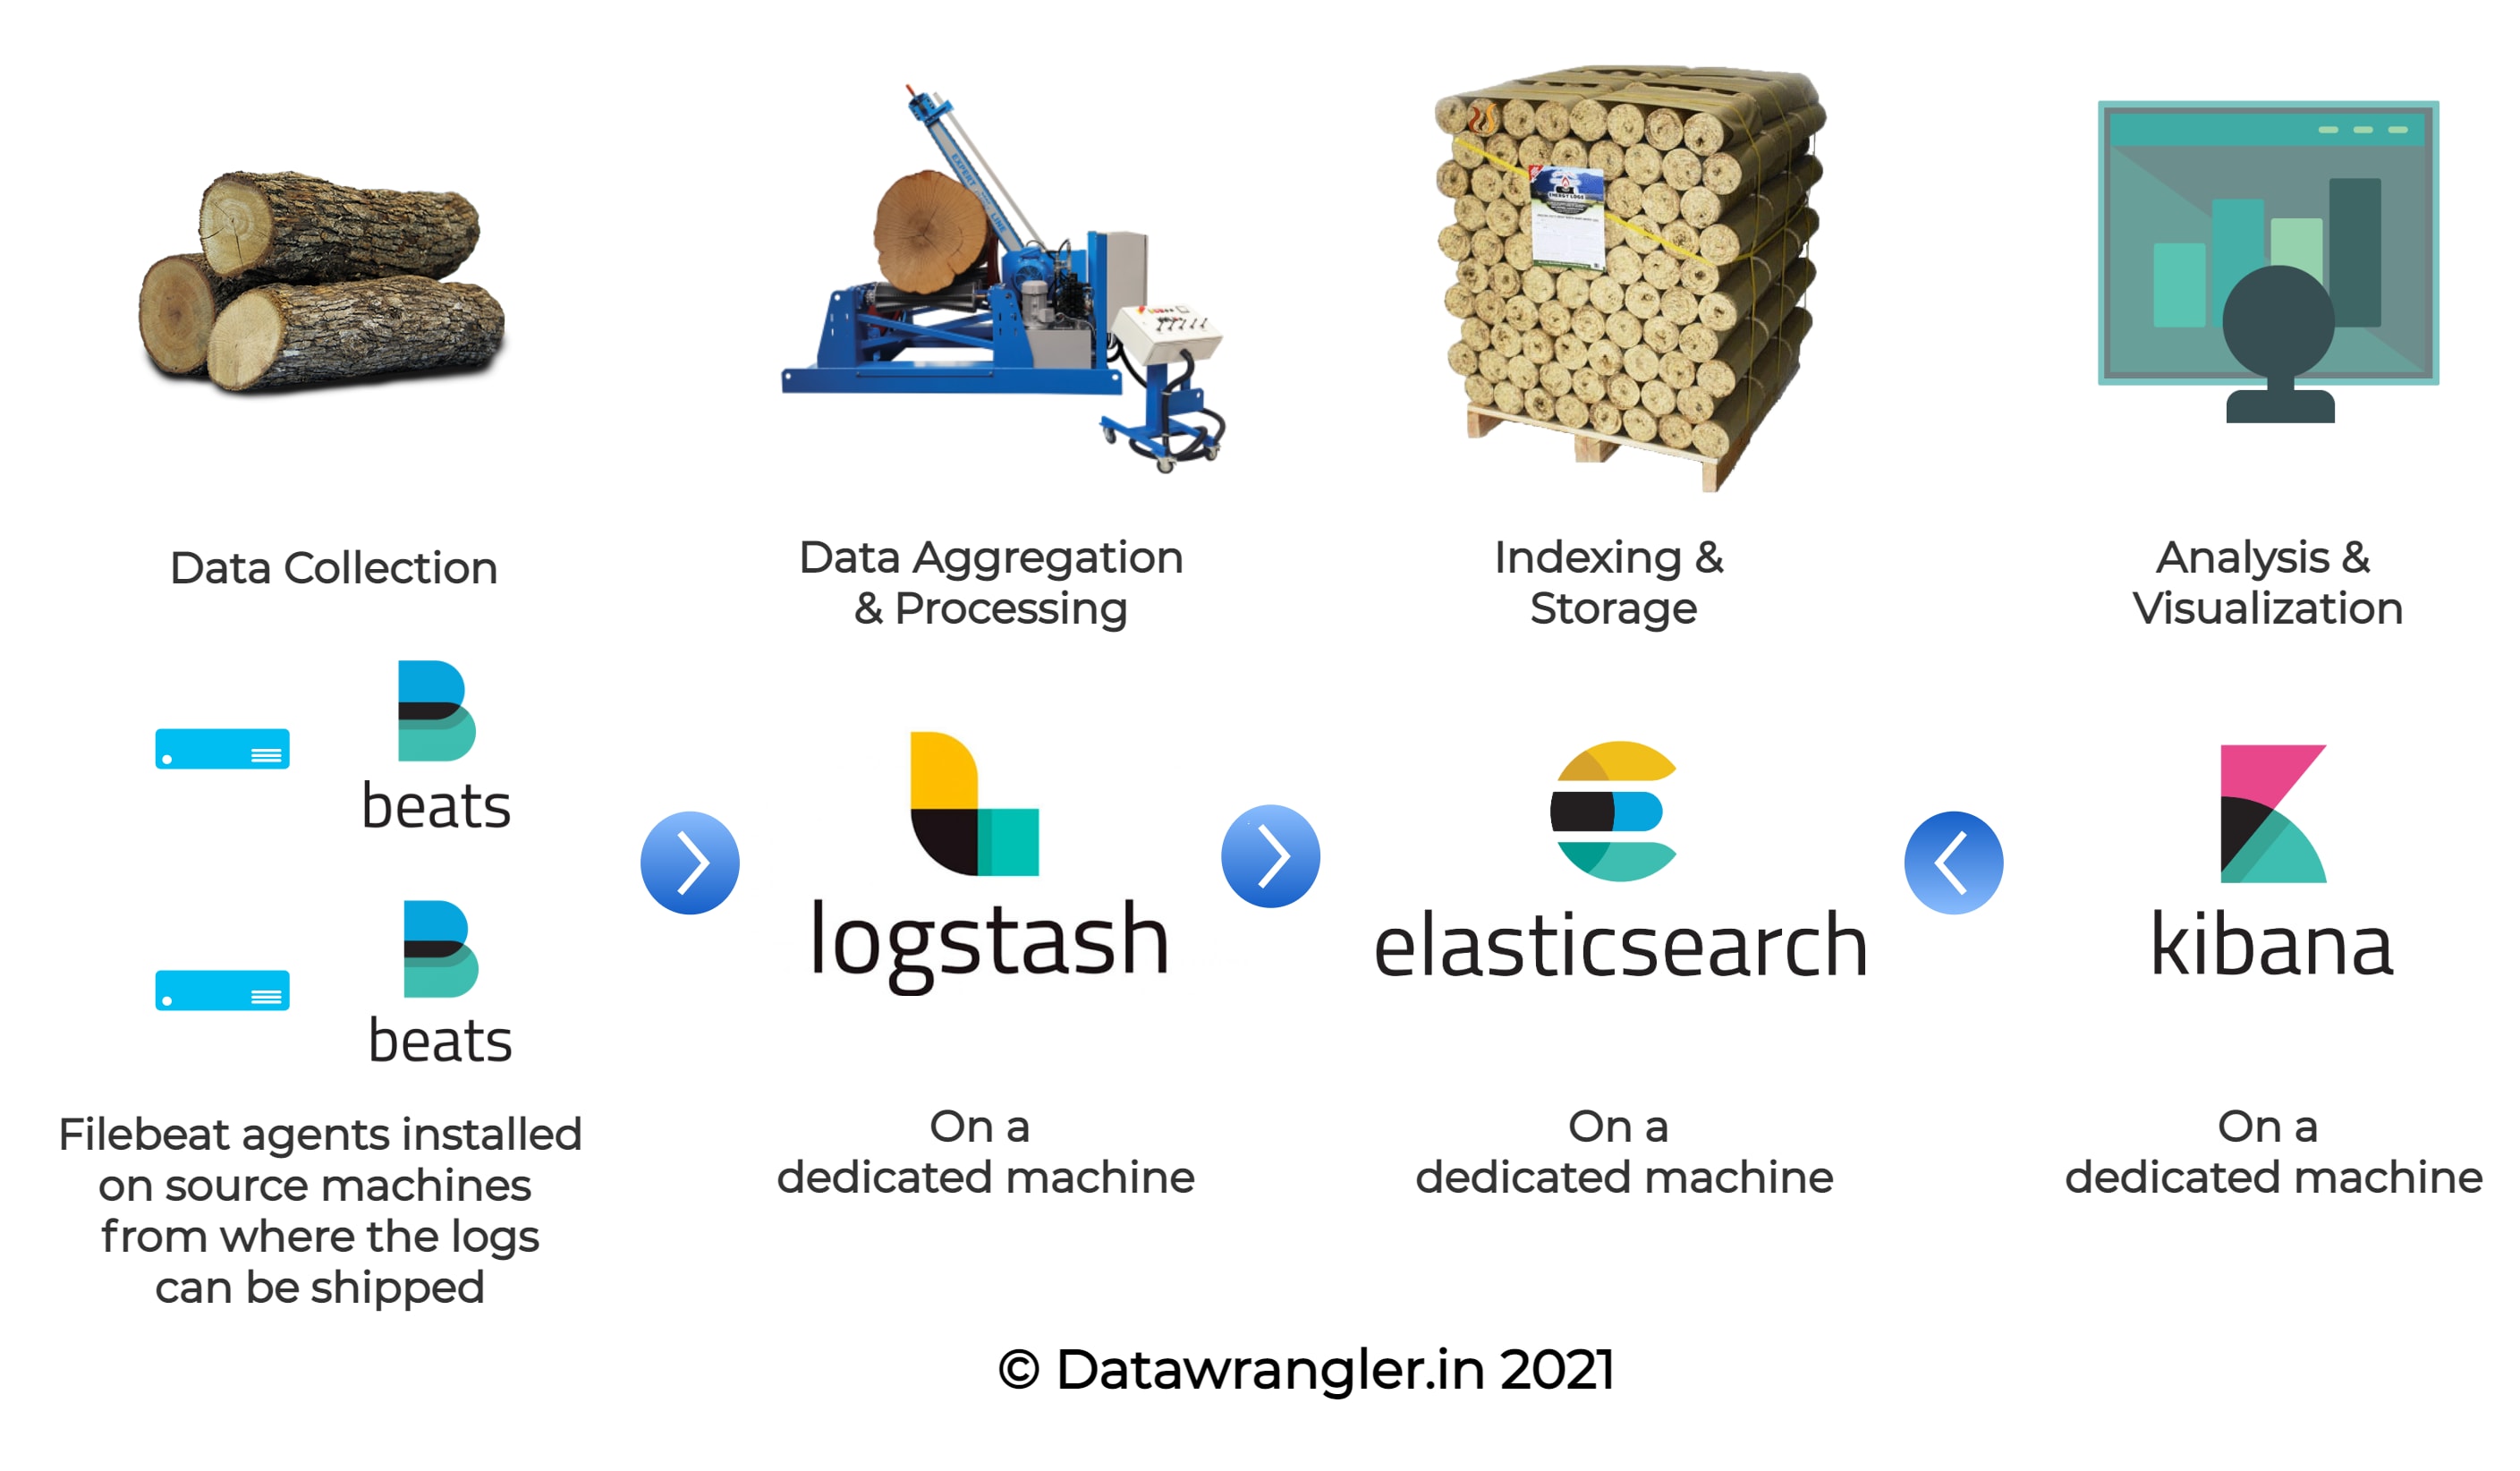
As seen in the above illustration, the ELK stack consists of four components in total and the functions of each component can be explained as:
- Beats - The Shipper - The logs need to be shipped to the log processor (Logstash) or the datastore (Elasticsearch) and
beatsagents installed on the machines do the shipping. - Logstash - The Processor - Based on the type of logs, the patterns are defined in Logstash pipelines and the raw lines of logs are transformed into JSON objects here.
- Elasticsearch - The Reservoir - The processed logs will be stored as documents under indices in Elasticsearch.
- Kibana - The Visualizer - Kibana runs on top of an Elasticsearch service and visualizes the indices present in the Elasticsearch.
This tutorial is tested on Ubuntu 20.04.1 LTS Codename: Focal and it is advisable to have at least 4GB of RAM and 8GB of Hardisk available.
Dataset
Before we begin, we need an understanding of what our source looks like. It is always better to create a new directory in which we can clone all the required components; let’s create a new directory known as es_tutorial, in which we will be performing all our activities. The dataset for the current exercise can be downloaded and used by executing the following commands:
> mkdir es_tutorial
> cd es_tutorial
> wget https://download.elastic.co/demos/logstash/gettingstarted/logstash-tutorial.log.gz
> gzip -d logstash-tutorial.log.gz
> head -n1 logstash-tutorial.log
A sample of the log file contains rows of log entries as given below:
83.149.9.216 - - [04/Jan/2015:05:13:42 +0000] "GET /presentations/logstash-monitorama-2013/images/kibana-search.png HTTP/1.1" 200 203023 "http://semicomplete.com/presentations/logstash-monitorama-2013/" "Mozilla/5.0 (Macintosh; Intel Mac OS X 10_9_1) AppleWebKit/537.36 (KHTML, like Gecko) Chrome/32.0.1700.77 Safari/537.36"
As a result of this exercise, we will be transporting log entries like these into transformed JSON encoded strings using Logstash as given below:
{
  "IP": "83.149.9.216",
  "Date": "04/Jan/2015:05:13:42 +0000",
  "Method": "GET",
  "Route": "/presentations/logstash-monitorama-2013/images/kibana-search.png HTTP/1.1",
  "ResponseCode": "200",
  "BytesTransferred": "203023",
  "CompleteUrl": "http://semicomplete.com/presentations/logstash-monitorama-2013/",
  "UserAgent": "Mozilla/5.0 (Macintosh; Intel Mac OS X 10_9_1) AppleWebKit/537.36 (KHTML, like Gecko) Chrome/32.0.1700.77 Safari/537.36"
}
These JSON strings will be stored as documents in Elasticsearch and we will be visualizing in Kibana to create useful dashboards out of the logs.
Filebeat - The Shipper
Before we begin, It’s not just Elasticsearch, Logstash & Kibana, but there’s also another component to the stack which is vital for shipping the logs to Logstash - beats. Depending on the nature of the data source, we can choose from the beats family:
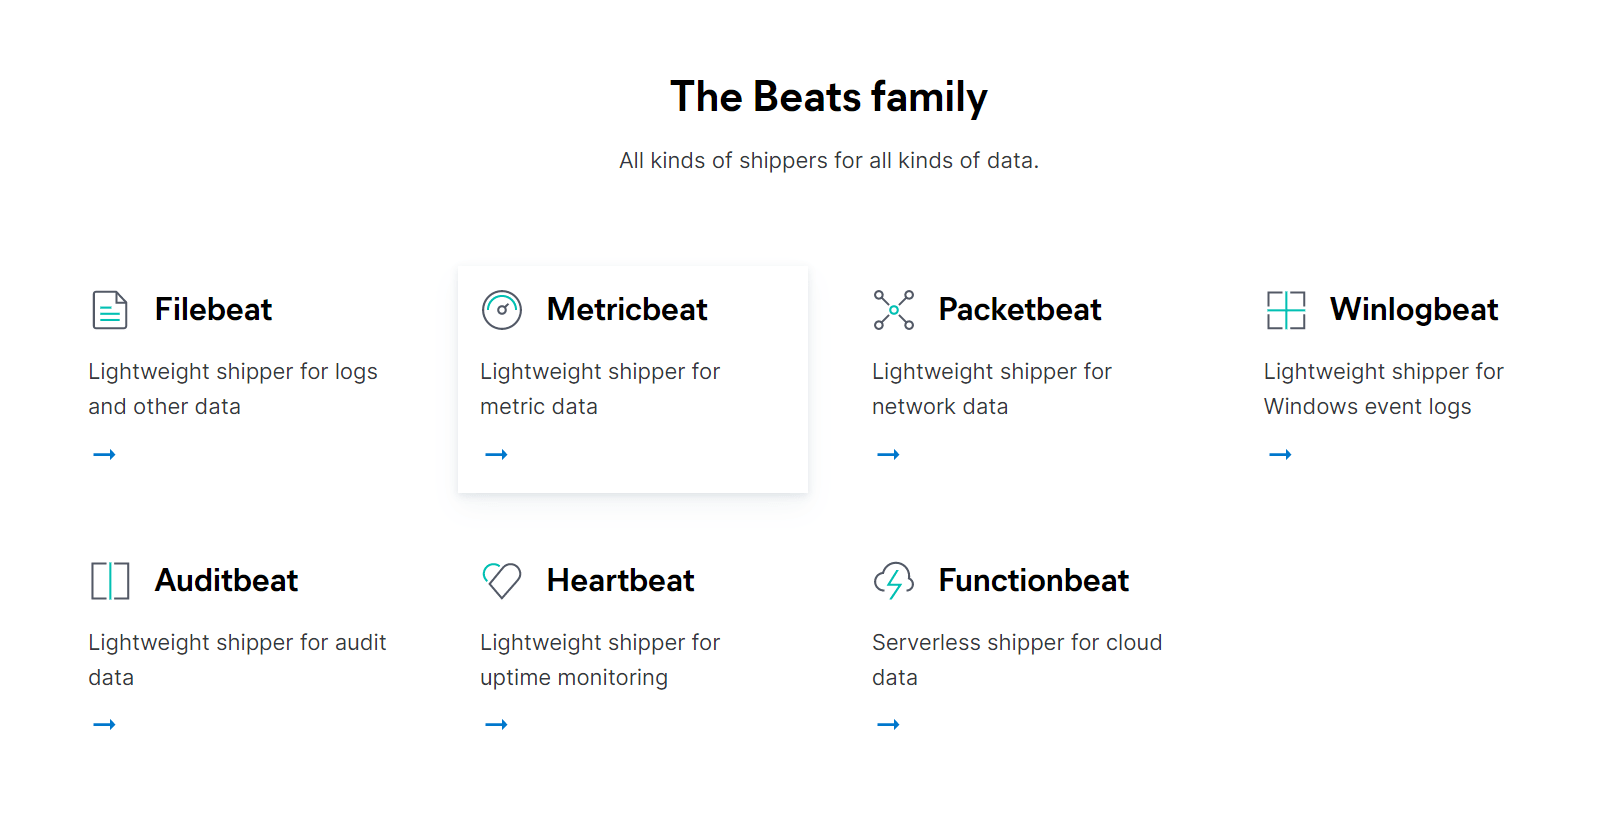
For this exercise, we will be looking at Filebeat - one of the commonly used log shippers. Filebeat ships the logs of APIs, web apps, and any file with readable lines to Logstash or Elasticsearch. This is the initial component in our log aggregation framework. Filebeat can ship the logs to either Elasticsearch directly or Logstash for processing.
a) Setup
Open a new terminal (Tty) tab, locate to our newly created directory es_tutorial if required, and inside the directory, enter the following commands:
> curl -L -O https://artifacts.elastic.co/downloads/beats/filebeat/filebeat-7.9.1-linux-x86_64.tar.gz

> tar xzvf filebeat-7.9.1-linux-x86_64.tar.gz

> chmod go-w filebeat-7.9.1-linux-x86_64/filebeat.yml
The above commands will install Filebeat on your machine, ready to ship the logs to Elasticsearch. Let’s try configuring the filebeat.
b) Configuration
Try opening the filebeat.yml file. This is where we will be configuring the location where filebeat can parse our logs from.
> cd filebeat-7.9.1-linux-x86_64
> nano filebeat.yml
In the opened file, remove all the contents and enter the following. Replace /path/to/file/logstash-tutorial.log with the absolute path to the location where the tutorial file has been downloaded. The file instructs filebeat to post all the logs to logstash running on port 5044 on the same machine. If the Logstash is on a different machine, the hostname will differ.
#filebeat-7.9.1-linux-x86_64/filebeat.yml
filebeat.inputs:
- type: log
  paths:
    - /path/to/file/logstash-tutorial.log
#absolute path to the log file
output.logstash:
  hosts: ["localhost:5044"]
Logstash - The Processor
In the previous section, we had configured filebeat to ship the logs. On the receiving end, we need Logstash to process the raw log entries that were shipped. Logstash helps you to create pipelines to facilitate this transformation from raw logs to processed JSON objects using specific patterns to filter out the elements from the log entries. We will be using Grok Patterns to facilitate this transformation.
a) Setup
Open a new terminal (Tty) tab, locate to our newly created directory es_tutorial if required, and inside the directory, enter the following commands:
> wget https://artifacts.elastic.co/downloads/logstash/logstash-7.9.1.tar.gz
> tar -xzf logstash-7.9.1.tar.gz
> cd logstash-7.9.1/
> sudo apt install openjdk-11-jre-headless
b) Configuration
We will be required to edit two configuration files in logstash. These include:
./logstash-7.9.1/config/pipeline1.conf- This file might not be present and needs to be manually created. For each log format that is sent by Filebeats, a corresponding pipeline.conf file needs to be created with the pattern to be filtered. It consists of two parameters: input and output. Input will correspond to the source i.e.) Filebeats port number and the output will correspond to the target i.e.) Elasticsearch../config/pipelines.yml- This YAML file is to list all the pipelines defined, to let Logstash know which of the pipelines are active. The pipelines listed in this file will only be considered by Logstash.> cd logstash-7.9.1/ > nano ./config/pipeline1.conf
Remove any contents, if present, and enter the following text to the pipeline1.conf file:
input {
    beats {
        port => "5044"
    }
}

filter {
  grok {
    match => {"message" => "%{IPV4:IP} \- \- \[%{HTTPDATE:Date}\] \"%{WORD:Method} %{GREEDYDATA:Route}\" %{NUMBER:ResponseCode} %{NUMBER:BytesTransferred} \"%{GREEDYDATA:CompleteUrl}\" \"%{GREEDYDATA:UserAgent}\""
 }

output {
    elasticsearch {
        hosts => [ "localhost:9200" ]
        index => "tutorial-%{+YYYY.MM.dd}"
    }
}
Filebeat sends the raw log entry mapped to a key known as message and that’s the reason why the filter section contains the grok pattern mapped to the message. Learning grok pattern is very important when it comes to creating custom patterns. You can check if your patterns are correct from the website: here and you can find the fragments of your grok pattern from here.
Similar to regular expressions, writing the perfect grok pattern is an art and you can master writing grok patterns only with practice.
Now that we have the pipeline ready, let’s activate this pipeline by editing the pipelines.yml file as shown below:
> nano ./config/pipelines.yml
Start editing the file contents by pasting the following to the file:
# ID is to identify the pipeline - enter anything
# path.config is the absolute path to the config file

- pipeline.id: my-pipeline_1
  path.config: "/etc/path/to/p1.config"
  pipeline.workers: 1
Now that we have configured Logstash, let’s move ahead in setting up Elasticsearch.
Elasticsearch - The Reservoir
Elasticsearch is a search engine based on Lucene. It can be used as a datastore by indexing JSON, facilitating the searches to be faster. As mentioned in the Logstash pipeline, Elasticsearch listens to port number 9200 and through this port, the processed log gets transported to Elasticsearch. The following commands will install Elasticsearch on your machine and starts the Elasticsearch service.
a) Setup
Open a new terminal (Tty) tab, locate to our newly created directory es_tutorial if required, and inside the directory, enter the following commands:
> wget https://artifacts.elastic.co/downloads/elasticsearch/elasticsearch-7.9.1-linux-x86_64.tar.gz
> tar -xzf elasticsearch-7.9.1-linux-x86_64.tar.gz
> cd elasticsearch-7.9.1/
> current_loc=`pwd`
> echo -e "\nES_HOME=\$PATH:${current_loc}" >> ~/.bashrc
> source ~/.bashrc

# To Start Elasticsearch
> ./bin/elasticsearch
b) Understand the Directories
With the Elasticsearch service now set up, it is better to get an understanding of what the individual directories do. This will help in troubleshooting and tuning the performance of Elasticsearch if required.
| Type | Description | Default Location | Setting |
|---|---|---|---|
| home | Elasticsearch home directory or $ES_HOME | Directory created by unpacking the archive | |
| bin | Binary scripts including Elasticsearch to start a node and elasticsearch-plugin to install plugins | $ES_HOME/bin | |
| conf | Configuration files including elasticsearch.yml | $ES_HOME/config | ES_PATH_CONF |
| data | The location of the data files of each index/shard allocated on the node. Can hold multiple locations. | $ES_HOME/data | path.data |
| logs | Log files location. | $ES_HOME/logs | path.logs |
| plugins | Plugin files location. Each plugin will be contained in a subdirectory. | $ES_HOME/plugins | |
| repo | Shared file system repository locations. Can hold multiple locations. A file system repository can be placed into any subdirectory of any directory specified here. | Not configured | path.repo |
Kibana - The Visualizer
The last piece to the puzzle is Kibana, the visualization and querying platform for Elasticsearch. The processed logs that are stored in Elasticsearch, can be processed in Kibana by performing aggregations and creating dashboards out of the KPIs. Kibana runs on port number 5601.
Setup
Open a new terminal (Tty) tab, locate to our newly created directory es_tutorial if required, and inside the directory, enter the following commands:
curl -O https://artifacts.elastic.co/downloads/kibana/kibana-7.9.1-linux-x86_64.tar.gz
tar -xvzf kibana-7.9.1-linux-x86_64.tar.gz
cd kibana-7.9.1-linux-x86_64/
./bin/kibana
Make sure that Elasticsearch is up and running before you could set up and start Kibana. In the next section, let’s start all our installed components and check if the stack that we had built does the log aggregation for us.
Testrun
Assuming that we have individual tabs open for each component, let’s start them one by one in the same order given below:
./bin/elasticsearch
./bin/kibana
# logstash-7.9.1
./bin/logstash -f ./config/pipeline1.conf --config.reload.automatic
# filebeat-7.9.1
./filebeat -e -strict.perms=false -c filebeat.yml -d "publish"
Now that our components are running, let’s open the browser and locate the URL: http://localhost:9200/_cat/indices. This will list the indices available. You can find a new index with the format: tutorial-YYYY.MM.DD. This contains the rows of logs indexed as documents which can be verified by locating to http://localhost:9200/tutorial-YYYY.MM.DD/_search as shown in the following video:
Visualizing Data in Kibana
The logs can be visualized in Kibana by setting up the index pattern.Locate the URL: http://localhost:5601 and follow the steps given in the following video:
Dashboards can be created in Kibana on top of these index patterns and the data can be visualized.
ELK Stack is a really good open-source option for creating a log aggregation framework and the practical applications of the stack can be enormous. With the good logging practices, this platform can even help you create a real-time dashboard of your business.