Tableau Vs PowerBI - Choosing the right BI Server for the Business
The choice of the Business Analytics tool and server is highly crucial for growing businesses, exclusively for the startups to visualize their KPIs. One wrong choice can lead to painful migrations of the visualizations and across clouds. The complete understanding of any BI tool can be understood by exploring its documentation.
If one wishes to compare it with other market leaders, there isn’t any honest comparison across the BI leaders except for the market research reports for BI tools from Gartner (Magic Quadrants for BI tools) which gives a detailed evaluation of the BI tools. Here, we evaluate both the market leaders of BI servers - Microsoft PowerBI and Tableau Server, evaluating their features and pricing, helping you to choose the right BI server for understanding your KPIs.
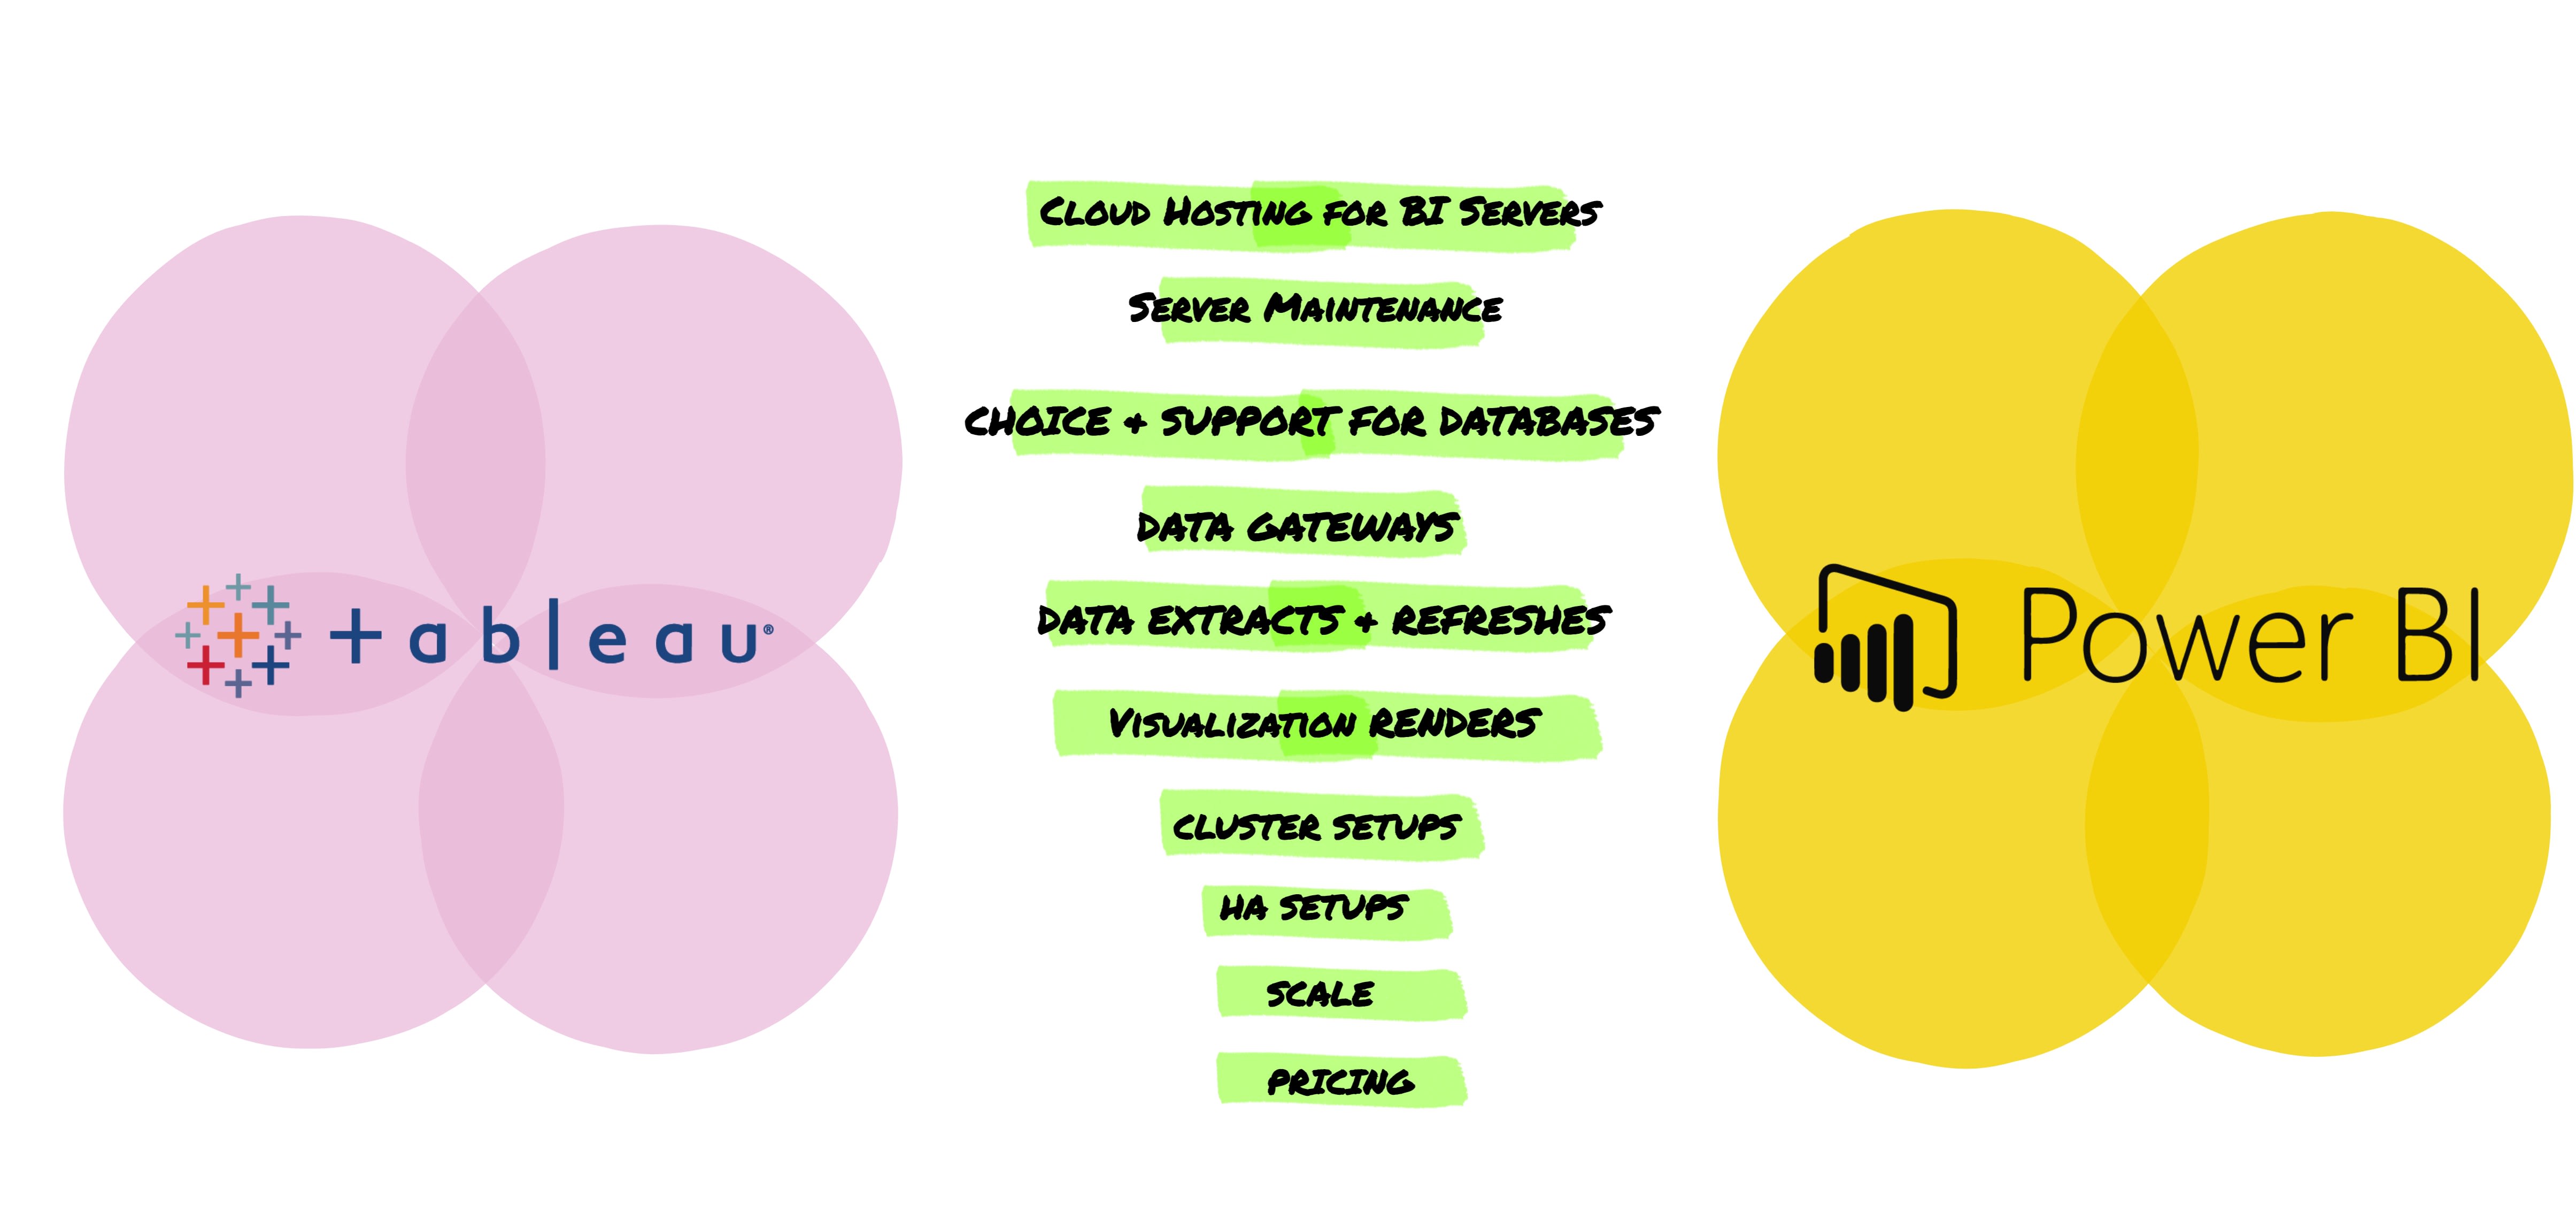
| Characteristic | Tableau | PowerBI |
|---|---|---|
| Cloud Hosting for BI Servers | Any Cloud - Complete control over Infrastructure | Azure Power BI Service Only |
| Hosting & Server Maintenance | Needs Admins & BI Engineers on a Tableau Server setup, Can also use Tableau Public | Microsoft does it for you |
| Choice & Support for Databases | All | All |
| Data Gateways | Optional | Mandatory for some data sources |
| Data Extracts & Refreshes | Number of Data Extract Refreshes (Scheduled & Manual) - Unlimited | Number of Manual Data Refreshes - Unlimited Number of Scheduled Data Refreshes - 8 (Shared Capacity) & 48 per day per dataset (Dedicated) |
| Visualization Renders | No limits - Dependent on the hardware used Visualization can be on dedicated nodes in cluster setups | Limited depending on the Dedicated capacity |
| Cluster Setups | Available | Unavailable |
| HA Setups | Available but SLA varies | 99% SLA |
| Scale | Dependent on the licenses purchased and Infrastructure | Dependent on the dedicated capacity |
| Pricing | See Below | See Below |
Choice of the Cloud & Databases
Are you a customer of the Microsoft family of suites or Azure Cloud? Are you using Microsoft SQL Server databases or Azure Synaptics SQL pools?
Think no further, Power BI will suit you better. The reason is, if the data source (data warehouse or transactional databases) that you are using is developed or maintained by Microsoft, you don’t need an on-premises data gateway to perform your data refreshes. Check if your database is compatible for not being required to have an on-premises data gateway from here.
In addition to this, depending on the nature of the business, Power BI provides solutions such as PowerBI Embedded (for embedding dashboards on to your platform) or Power BI premium, if just a collaborative environment is required.
Tableau also provides access to many data connectors and drivers to establish connectivity. Also, with the support of Tableau Server packages for Linux, Tableau servers have become much more efficient in managing the resources. Data gateways are optional unlike Power BI, where the data gateways are mandatory for non-native data sources. Tableau provides embedded solutions, with access to unlimited viewers too.

Data Extracts & Refreshes
How huge is your data? And are you using extracts or live connections?
The ability to devise a multi-node architecture for the tableau server is a better fit to improve the performance of the data extracts and data refreshes. Data refresh rates are not constrained and are dependent on the hardware.
Power BI also performs the heavy data refreshes with much ease, due to the configuration of the data gateway instance deployed in the same subnet as that of the databases (for Non-Microsoft family of databases).

Visualization Renders
Visualization is the core of the BI exercise. And if those dashboards are not loading on time, that will cost precious business hours. The rendering is dependent on the hardware - especially the memory. In Tableau, the hardware and tuning parameters are completely at the disposal of the tableau Admin. However, the server might have to be restarted while performing the upgrades to the hardware or tuning the parameters. This could also potentially lead to downtime.
This is not the case with Power BI where a premium or dedicated capacity can be purchased for the rendering to happen; the lowest configuration in dedicated capacity - A1 has a capacity of performing about 300 renders per hour with a price of 1$ approx per hour. As the audience grows, this capacity can be increased and when you go up the ladder from (A1 to A6) configuration, the price can go all the way up to 36 times that of the cost of A1.

Scale
How many viewers are about to have a look at your dashboards? Is it going to be the dashboard with your visualizations on it or is it going to be just the PDF rendering of your dashes?
For client-side renderings; Tableau has a cluster setup available to be configured with multiple nodes, each of which can be assigned with the specific processes and dozens of other tweak-able options in hand; scalability is at disposal for the Tableau admins.
Does it mean that Power BI is up for no good? No. They do have a dedicated capacity that can be modified based on the peak hour refresh rates and the number of renders happening in an hour.

Licenses & Pricing
Consider an Organization with about 200 data scientists and 100 business users; let’s estimate the pricing for both Tableau Server & Power BI Embedded.

Tableau Server - Components & Pricing
| Components | Pricing |
|---|---|
| Tableau Server Creator License - to use Tableau Desktop & publish to tableau server |
70$ per user per month |
| Tableau Server Viewer License - to just view the reports on the tableau server |
12$ per user per month |
| Infrastructure cost per hour - Single Node: (8 physical cores min + 32GB of RAM) Cluster Setup: Single Node + Child Nodes (4 physical cores + 16GB of RAM) x 2 | Single node: 0.70$ per hour; Cluster: 1.46$ per hour |
| Total Cost per month | Single Node: 16251$ Cluster:15704$ |
Power BI - Components & Pricing
The following estimation is done by assuming that the dedicated capacity is A4 (8 VCores + 25 GB of RAM).
| Components | Pricing |
|---|---|
| Pro License for the individual users to collaborate - per month | 9.99$ per user |
| A Power BI Embedded dedicated capacity for performing the refreshes on a custom workspace. Example: A4 | $8.06 per hour |
| A data gateway inside the same subnet as that of the database (4 cores + 16GB RAM minimum) | 0.38$ per hour |
| Total incurred cost (200x9.99)+(8.06x730)+(730x0.38) | 8159.2$ per month |
Conclusion
Designing a Business Analytics architecture for the organization, needs a futuristic thought to it. If rightly done, it could bring out a lot of Business Potential with cheaper costs as the organization grows. In addition to the aforementioned features, tuning the queries behind the visualizations and the servers based on the scale and throughput will be very instrumental in crafting an efficient Business Analytics hosting on the cloud.
Let’s build Visualisations; not wage wars!!